Data Visualization
This was my part of a collaborative project that involved taking primary and secondary research and designing a small booklet that visualizes and summarizes all that data in a simple and easy to digest format. My task was visualizing the survey and questionnaire data.
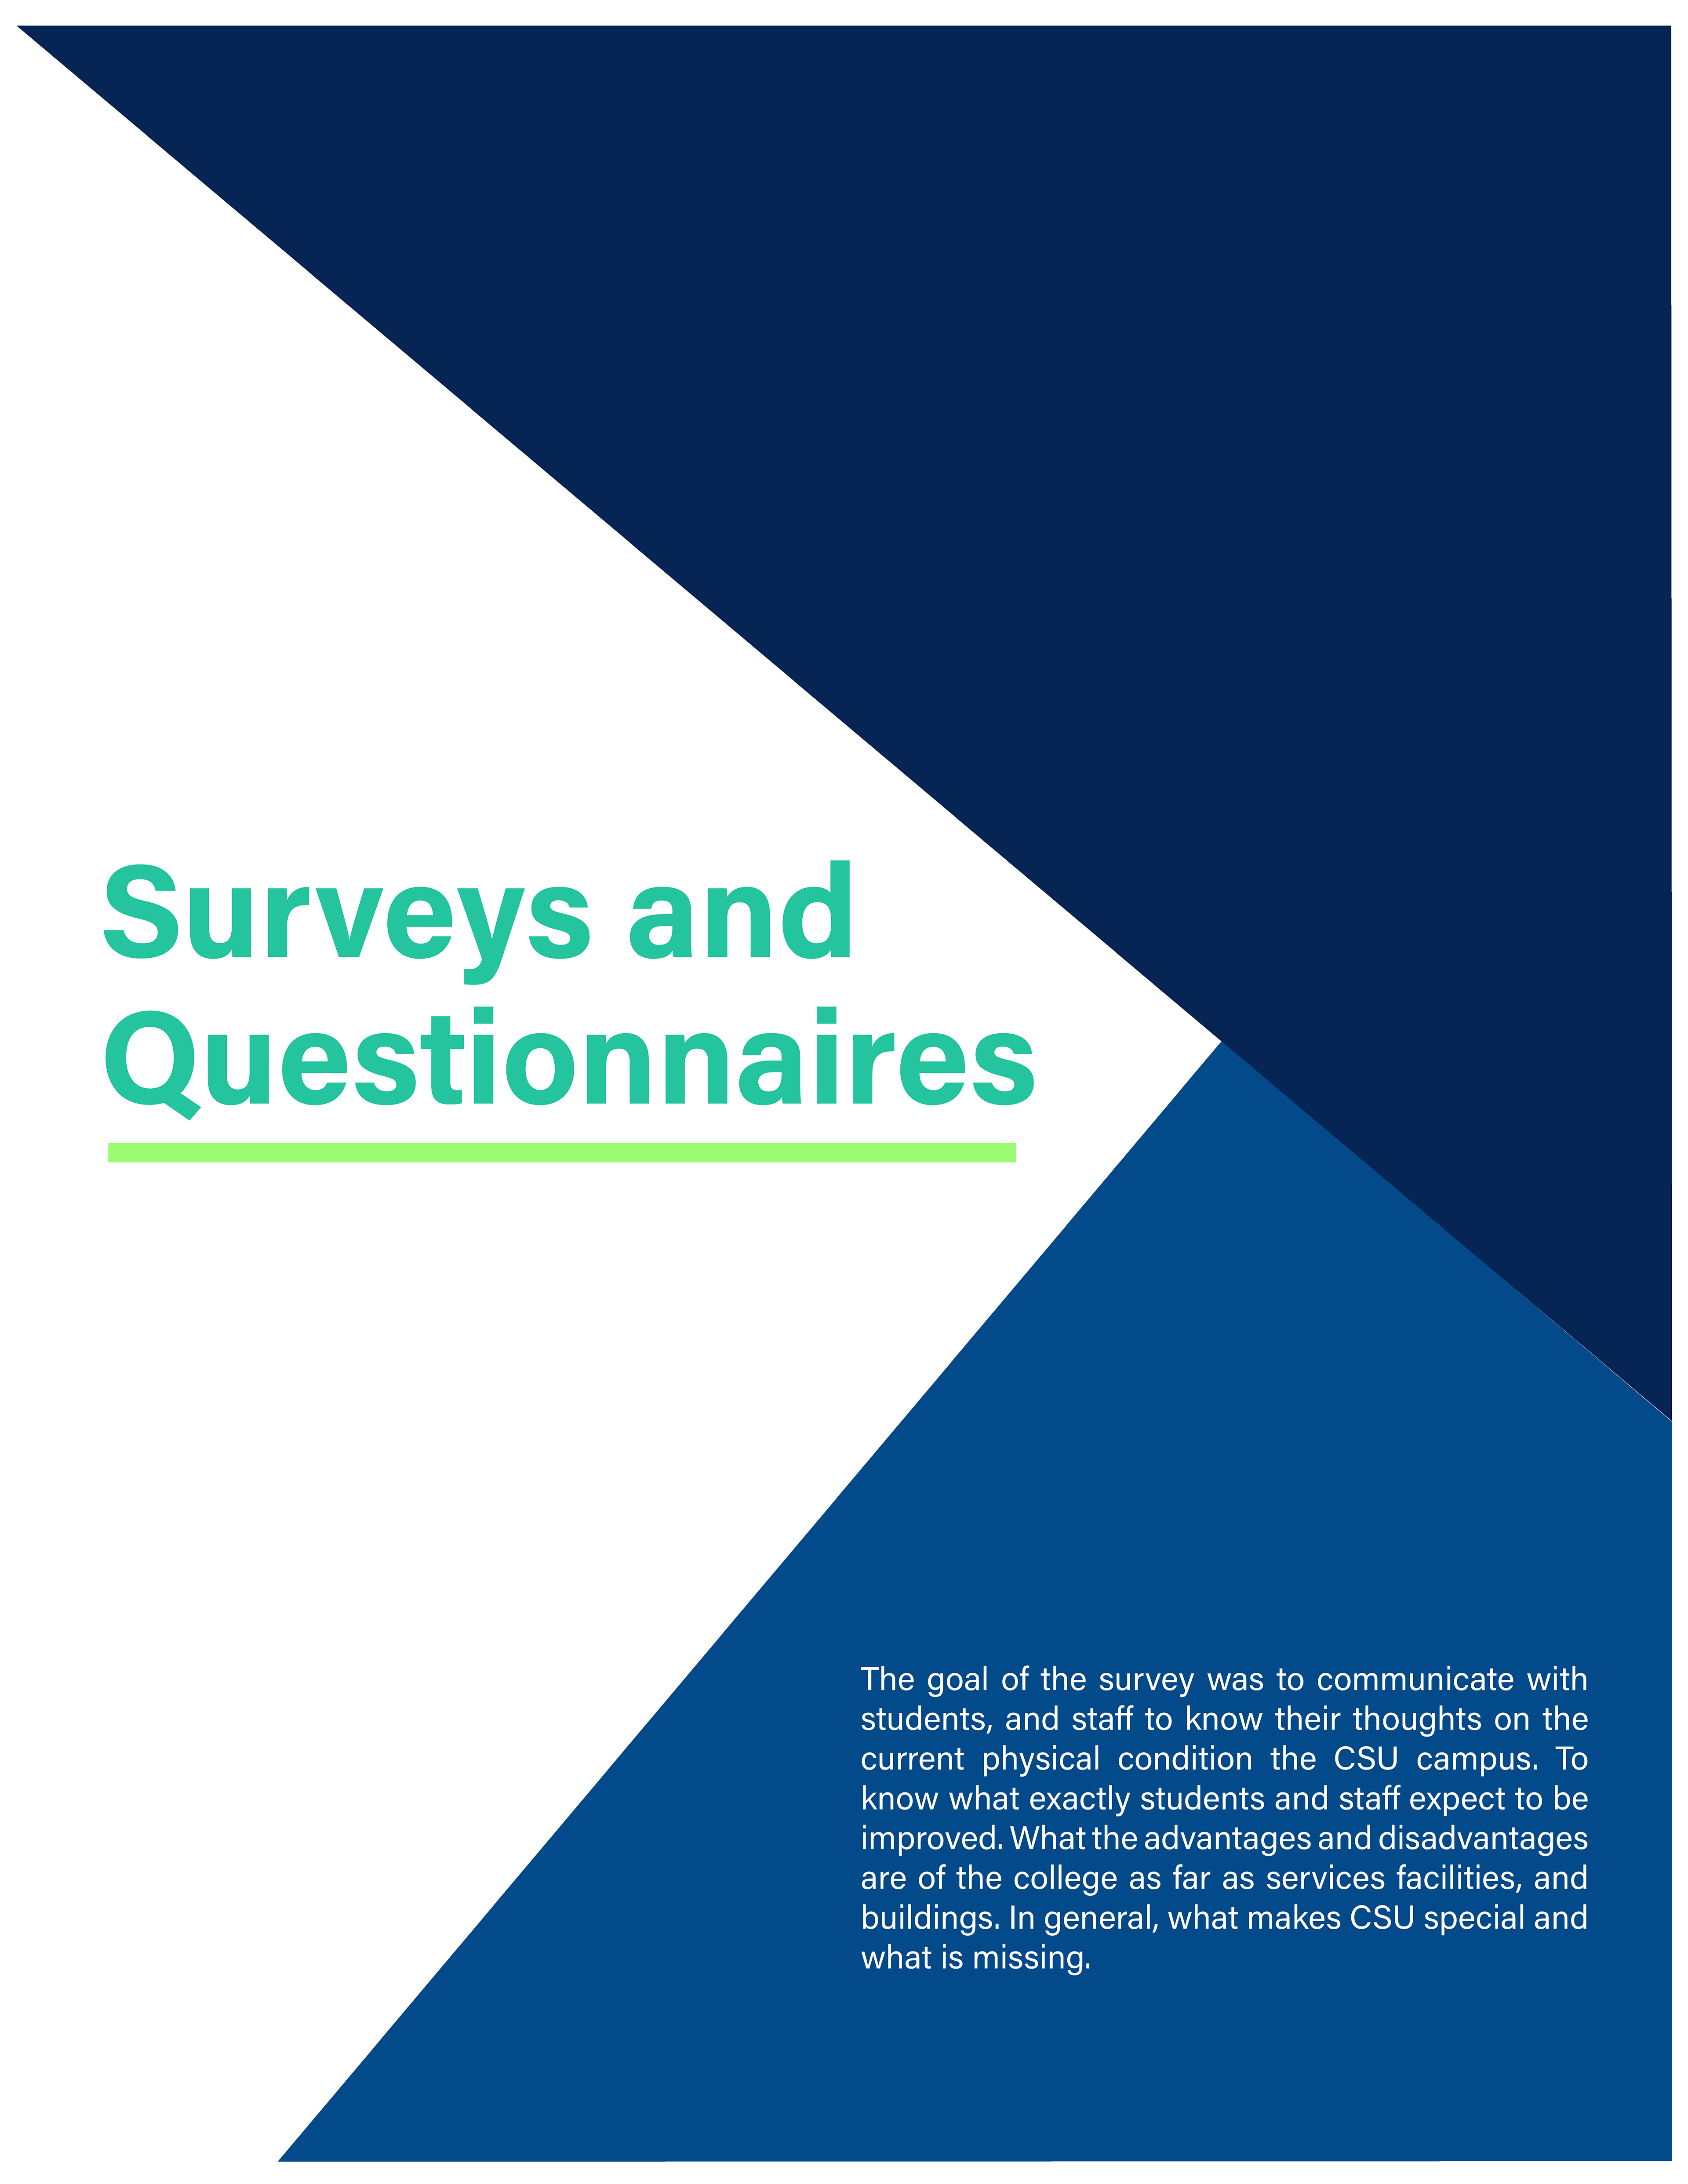
The questions pertain to the visual appeal of CSU’s campus. Specifically what needs improvement or what’s missing, what makes it special, and services available. Directed at students and faculty.
Click on the Image to the right to view the visualized survey data.
CSU Beautification (Environmental GD)
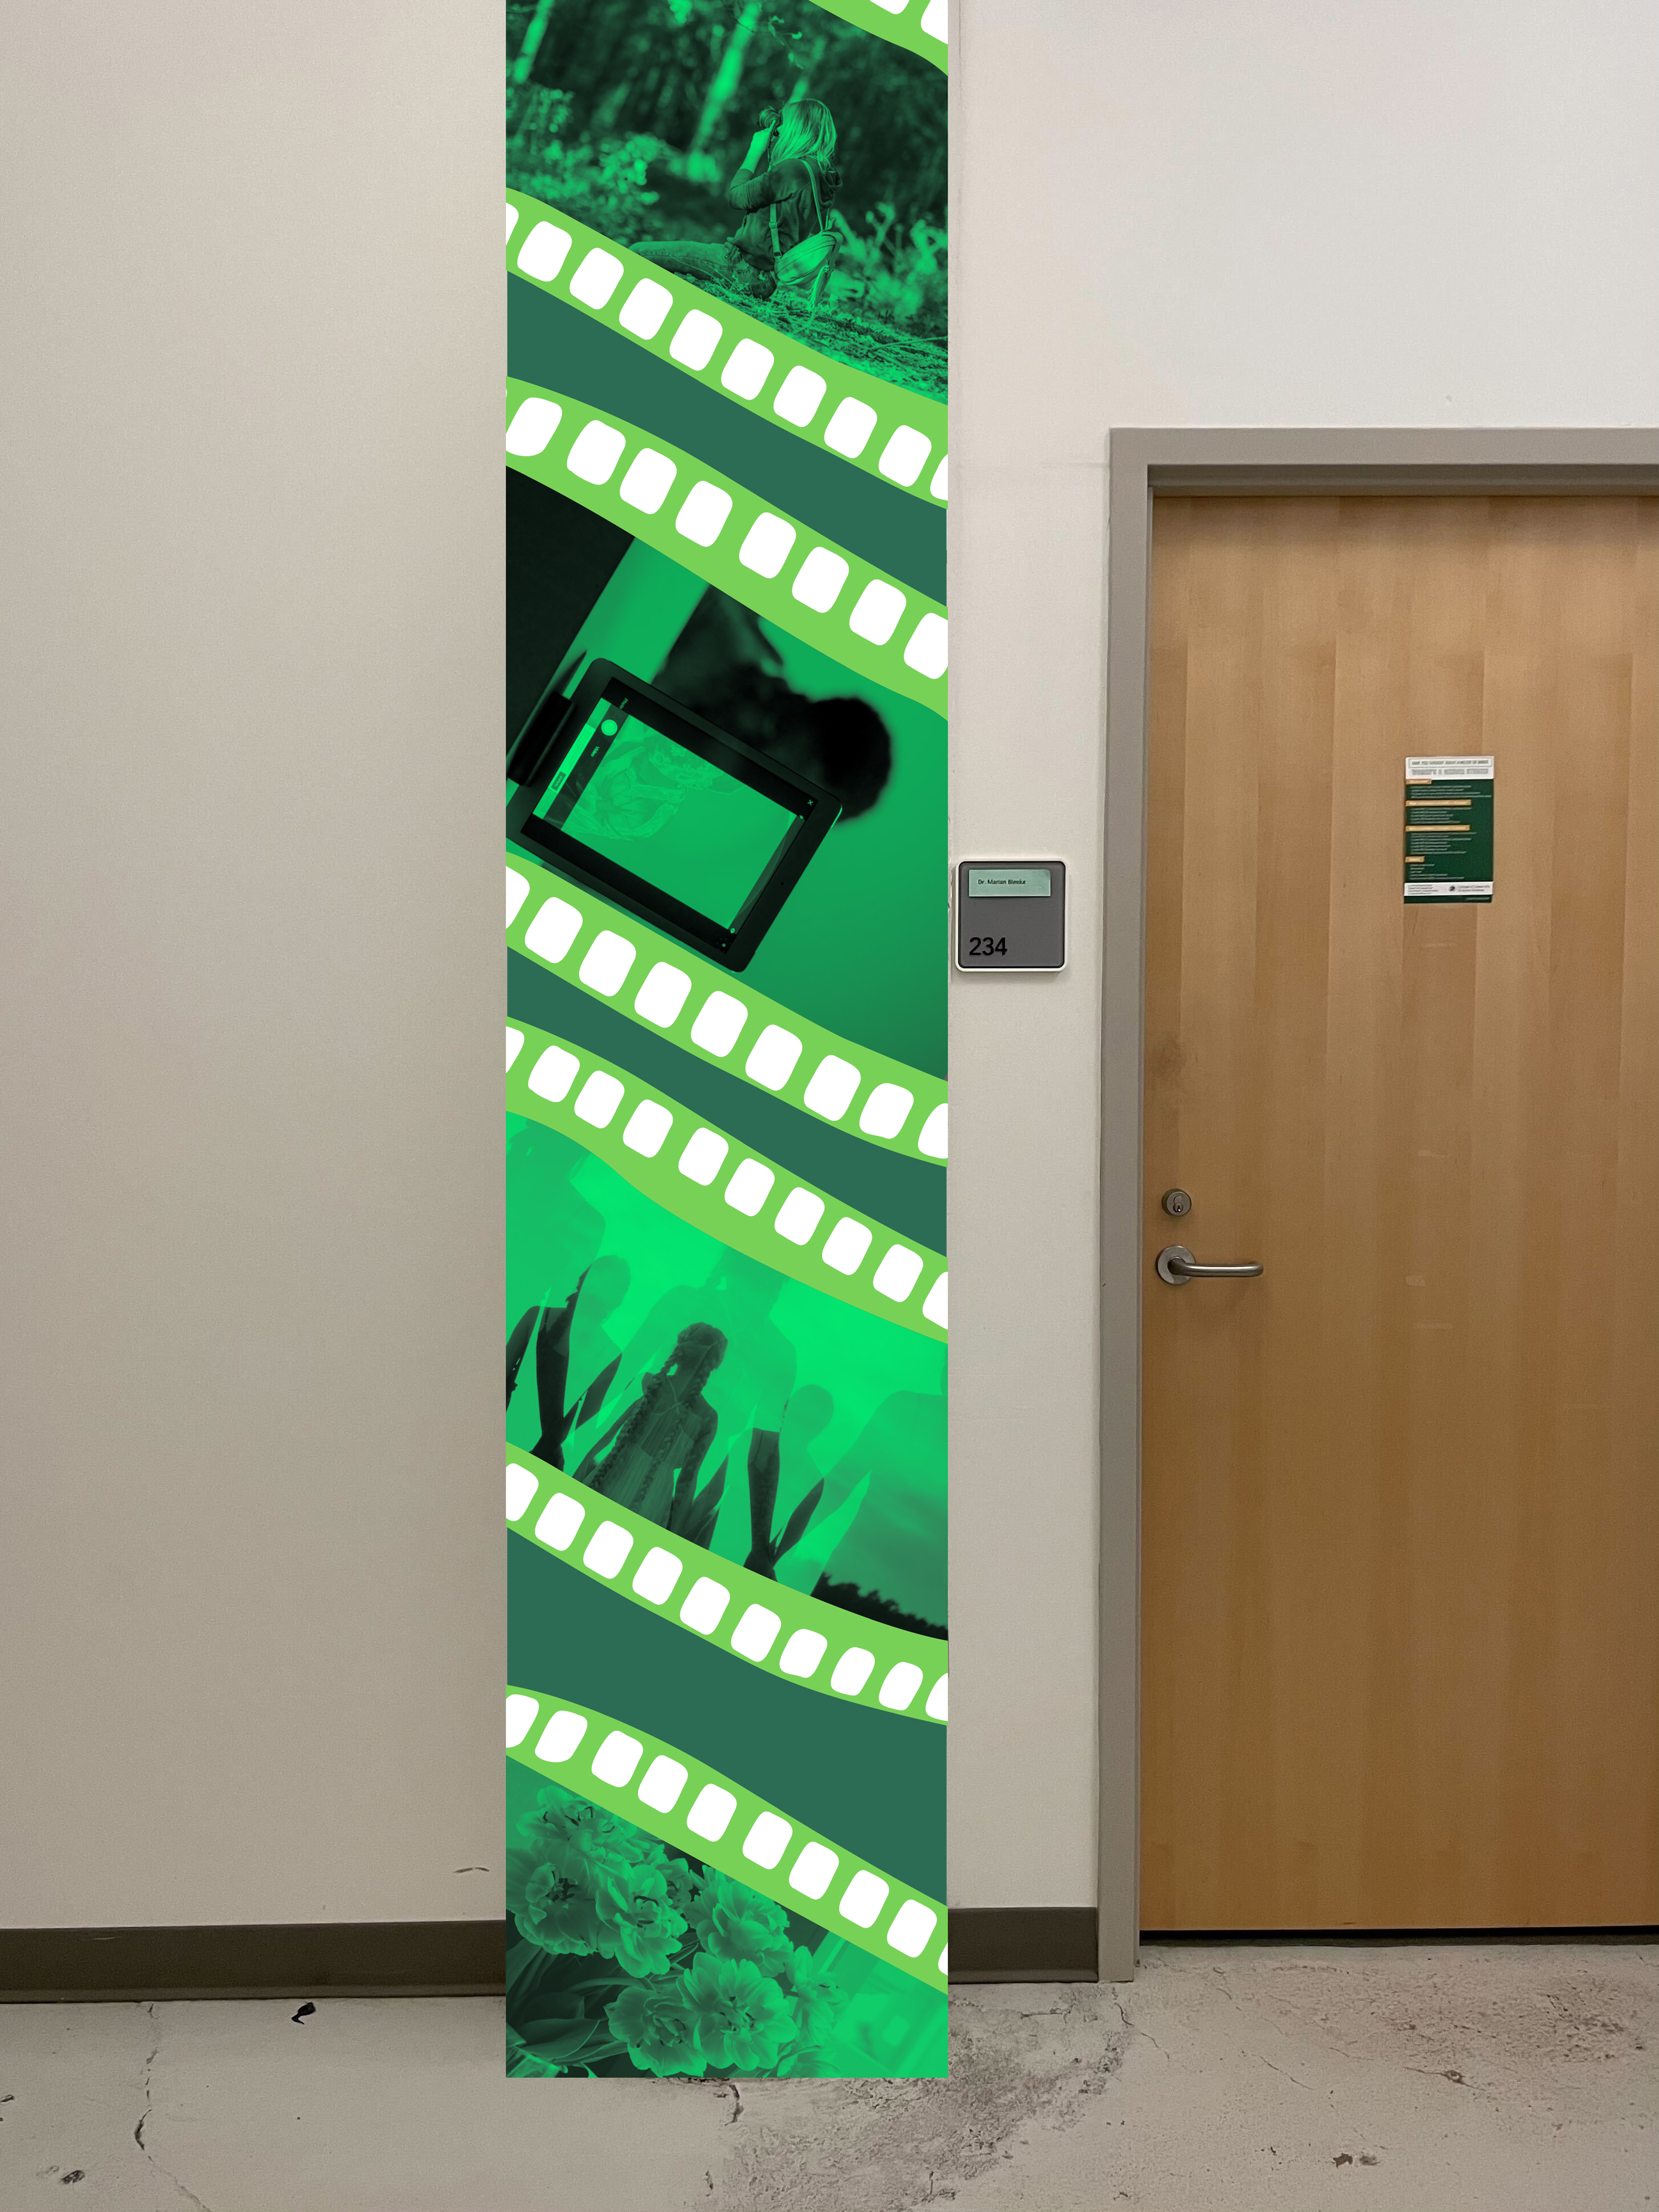
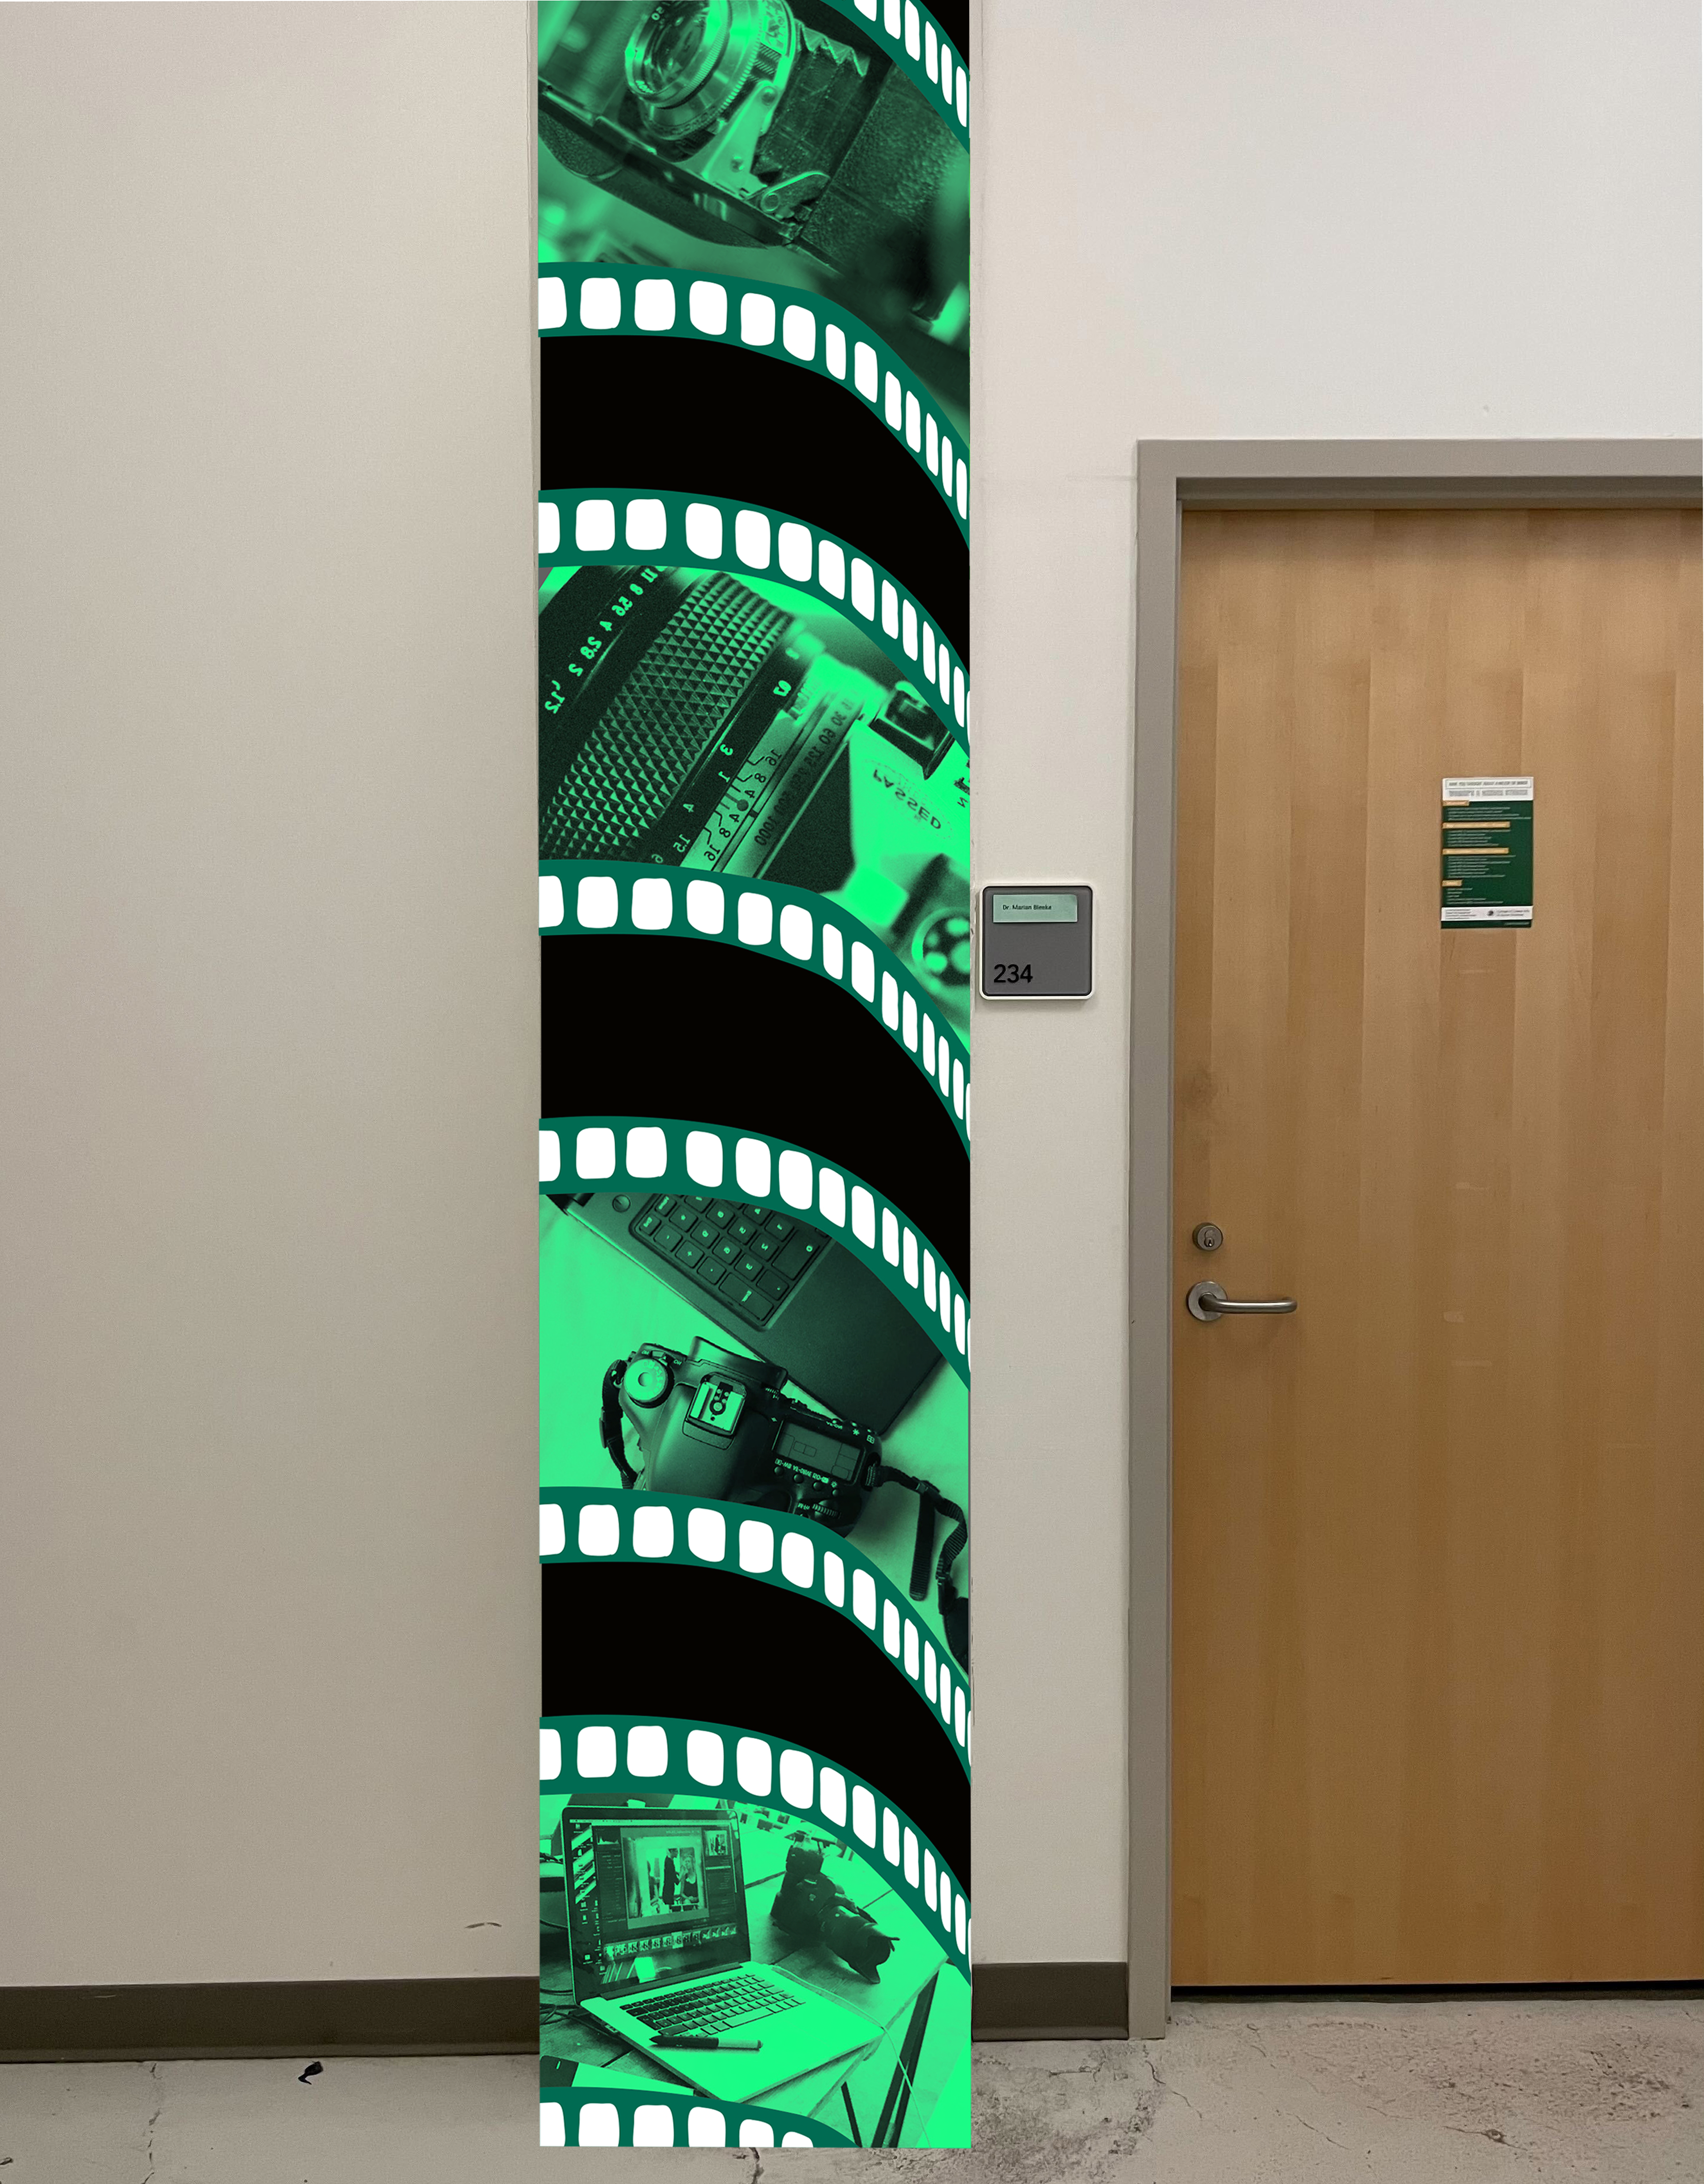
The Middough building houses the classrooms used by CSU’s more creative majors (art, design, photography, dance, etc.). Having minimal brand recognition, and being far from the main campus, this building was best candidate to implement the potential environmental design system
The challenges that we had to address included the pillars in random locations (as this building used to be a parking garage) and the blank walls everywhere.